Analysis pipeline
Overview
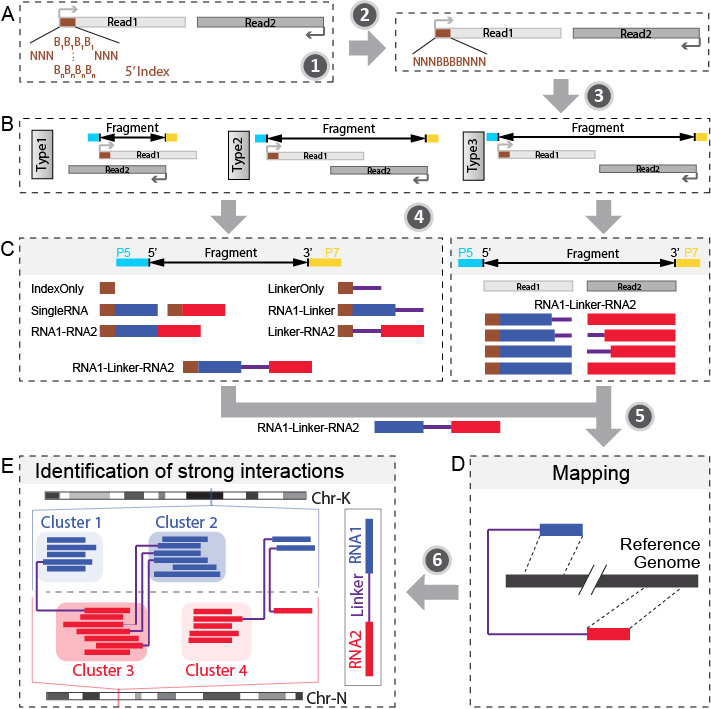
The next generation DNA sequencing based technology utilize RNA proximity ligation to transfrom RNA-RNA interactions into chimeric DNAs. Through sequencing and mapping these chimeric DNAs, it is able to achieve high-throughput mapping of nearly entire interaction networks. RNA linkers were introduced to mark the junction of the ligation and help to split the chimeric RNAs into two interacting RNAs. This bioinformatic pipeline is trying to obtain the strong interactions from raw fastq sequencing data. The major steps are:
- Step 1: Remove PCR duplicates.
- Step 2: Split library based on barcode.txt.
- Step 3: Recover fragments for each library.
- Step 4: Split partners and classify different types of fragments.
- Step 5: Align both parts of “Paired” fragment to the genome.
- Step 6: Determine strong interactions.
- Step 7: Visualization of interactions and coverages.
Other functions:
- Determine the RNA types of different parts within fragments.
- Find linker sequences within the library.
- Find intersections between two different interaction sets based on genomic locations
- Find intersections between two different interaction sets based on annotation
- RNA structure prediction by adding digestion site information
- splicing intermediates detection within snoRNA-mRNA interactions
Pipeline
Step 1: Remove PCR duplicates.
Starting from the raw pair-end sequencing data, PCR duplicates should be removed as the first step if both the 10nt random indexes and the remaining sequences are exactly the same for two pairs. It is achieved by remove_dup_PE.py
usage: remove_dup_PE.py [-h] reads1 reads2

Remove duplicated reads which have same sequences for both forward and reverse
reads. Choose the one appears first.

positional arguments:
  reads1      forward input fastq/fasta file
  reads2      reverse input fastq/fasta file

optional arguments:
  -h, --help  show this help message and exit

Library dependency: Bio, itertools
The program will generate two fastq/fasta files after removind PCR duplicates and report how many read pairs has been removed. The output are prefixed with ‘Rm_dupPE’
Note
One pair is considered as a PCR duplicate only when the sequences of both two ends (including the 10nt random index) are the exactly same as any of other pairs.
Step 2: Split library based on barcode.txt.
After removing PCR duplicates, the libraries from different samples are separated based on 4nt barcodes in the middle of random indexes (“RRRBBBBRRR”; R: random, B: barcode). It is implemented by split_library_pairend.py
usage: split_library_pairend.py [-h] [-f | -q] [-v] [-b BARCODE]
                                [-r RANGE [RANGE ...]] [-t] [-m MAX_SCORE]
                                input1 input2

Example: split_library_pairend.py -q Rm_dupPE_example.F1.fastq
         Rm_dupPE_example.R1.fastq -b barcode.txt

positional arguments:
  input1                input fastq/fasta file 1 for pairend data (contain
                        barcodes)
  input2                input fastq/fasta file 2 for pairend data

optional arguments:
  -h, --help            show this help message and exit
  -f, --fasta           add this option for fasta input file
  -q, --fastq           add this option for fastq input file
  -v, --version         show program's version number and exit
  -b BARCODE, --barcode BARCODE
                        barcode file
  -r RANGE [RANGE ...], --range RANGE [RANGE ...]
                        set range for barcode location within reads,default is
                        full read
  -t, --trim            trim sequence of 10nt index
  -m MAX_SCORE, --max_score MAX_SCORE
                        max(mismatch+indel) allowed for barcode match,
                        otherwise move reads into 'unassigned' file
                        default: 2.

Library dependency: Bio
Here is a example for barcode.txt
ACCT
CCGG
GGCG
The output of this script are several pairs of fastq/fasta files prefixed with the 4nt barcode sequences, together with another pair of fastq/fasta files prefixed with ‘unassigned’.
For example, if the input fastq/fasta files are Rm_dupPE_example.F1.fastq and Rm_dupPE_example.R1.fastq, and the barcode file is the same as above, then the output files are:
- ACCT_Rm_dupPE_example.F1.fastq
- ACCT_Rm_dupPE_example.R1.fastq
- CCGG_Rm_dupPE_example.F1.fastq
- CCGG_Rm_dupPE_example.R1.fastq
- GGCG_Rm_dupPE_example.F1.fastq
- GGCG_Rm_dupPE_example.R1.fastq
- unassigned_Rm_dupPE_example.F1.fastq
- unassigned_Rm_dupPE_example.R1.fastq
Step 3: Recover fragments for each library.
After splitting the libraries, the later steps from here (Step 3-7) need to be executed parallelly for each sample.
In this step, we are trying to recover the fragments based on local alignment. The fragments are classifed as several different types as shown in the figure below. The flow chart is also clarified at the top.
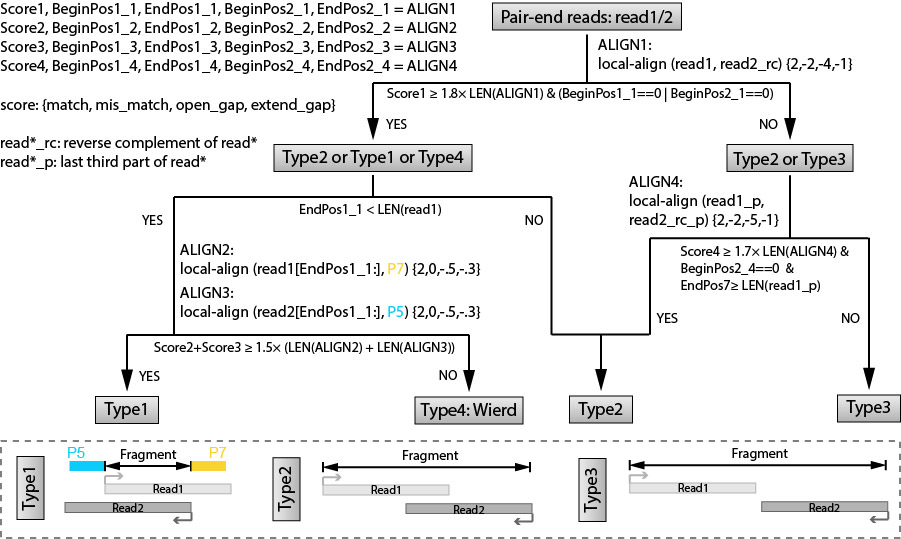
We will use a complied program recoverFragment to do that
recoverFragment - recover fragment into 4 different categories from pair-end seq data
=====================================================================================

SYNOPSIS

DESCRIPTION
    -h, --help
          Displays this help message.
    --version
          Display version information
    -I, --inputs STR
          input of forward and reverse fastq file, path of two files separated by SPACE
    -p, --primer STR
          fasta file contianing two primer sequences
    -v, --verbose
          print alignment information for each alignment

EXAMPLES
    recoverFragment -I read_1.fastq read_2.fastq -p primer.fasta
          store fragment using fasta/fastq into 4 output files
          'short_*', 'long_*','evenlong_*','wierd_*'

VERSION
    recoverFragment version: 0.1
    Last update August 2013
Step 4: Split partners and classify different types of fragments.
When we recovered the fragments, the next we are goting to do is to find RNA1 and RNA2 that are seprarated by the linkers, and from here, we will be able to classify the fragments into different types: “IndexOnly”, “NoLinker”, “LinkerOnly”, “BackOnly”, “FrontOnly”, “Paired”. (see the figure below).
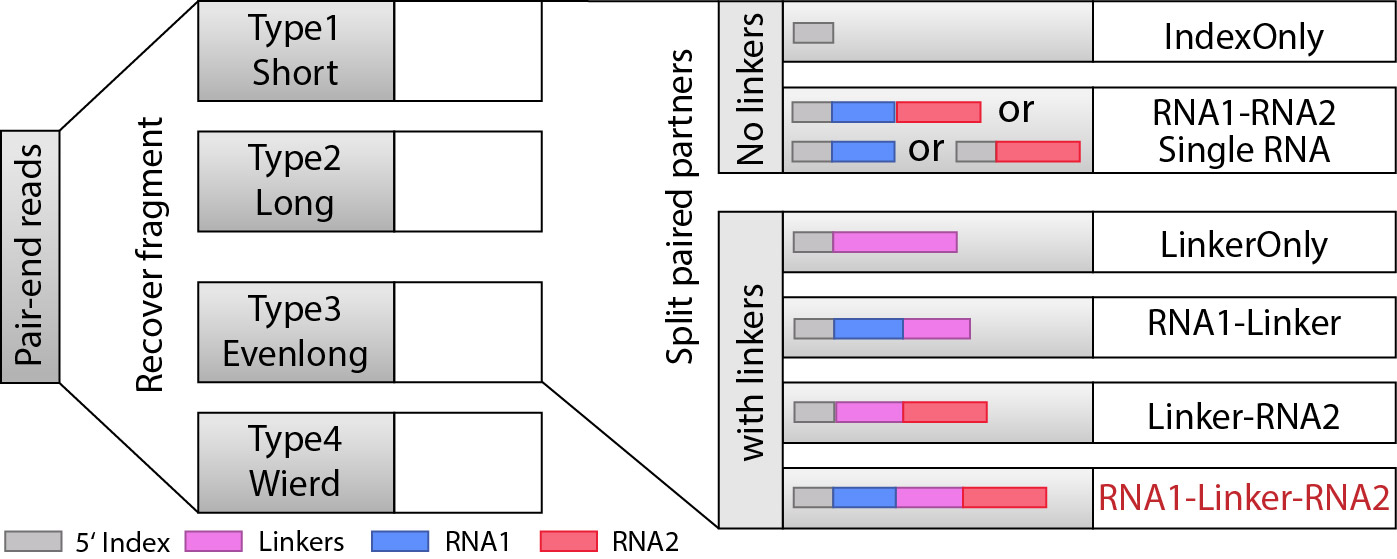
This will be done by split_partner.py
usage: split_partner.py [-h] [-e EVALUE] [--linker_db LINKER_DB]
                        [--blast_path BLAST_PATH] [-o OUTPUT] [-t TRIM]
                        [-b BATCH] [-l LENGTH]
                        input type3_1 type3_2

DESCRIPTION: Run BLAST, find linker sequences and split two parts connected by
linkers

positional arguments:
  input                 the input fasta file containing fragment sequences of
                        type1 and type2
  type3_1               read_1 for evenlong (type3) fastq file
  type3_2               read_2 for evenlong (type3) fastq file

optional arguments:
  -h, --help            show this help message and exit
  -e EVALUE, --evalue EVALUE
                        cutoff evalues, only choose alignment with evalue less
                        than this cutoffs (default: 1e-5).
  --linker_db LINKER_DB
                        BLAST database of linker sequences
  --blast_path BLAST_PATH
                        path for the local blast program
  -o OUTPUT, --output OUTPUT
                        output file containing sequences of two sepatated
                        parts
  -t TRIM, --trim TRIM  trim off the first this number of nt as index,
                        default:10
  -b BATCH, --batch BATCH
                        batch this number of fragments for BLAST at a time.
                        default: 200000
  -r, --release         set to allow released criterion for Paired fragment in
                        Type 3, include those ones with no linker in two reads
  -l LENGTH, --length LENGTH
                        shortest length to be considered for each part of the
                        pair, default: 15

Library dependency: Bio, itertools
Note
New option added in version 0.3.1, which could allow two different strategies for selection of “Paired” fragments from the Type3 fragments. The --release option will allow a read pair to be called as “Paired” fragment even when the linker are not detected in both reads.
The linker fasta file contain sequences of all linkers
>L1
CTAGTAGCCCATGCAATGCGAGGA
>L2
AGGAGCGTAACGTACCCGATGATC
The output fasta files will be the input file name with different prefix (“NoLinker”, “LinkerOnly”, “BackOnly”, “FrontOnly”, “Paired”) for different types. The other output file specified by -o contains information of aligned linker sequences for each Type1/2 fragment.
For example, if the commend is
split_partner.py fragment_ACCT.fasta evenlong_ACCTRm_dupPE_stitch_seq_1.fastq
    evenlong_ACCTRm_dupPE_stitch_seq_2.fastq
    -o fragment_ACCT_detail.txt --linker_db linker.fa
- Then, the output files will be:
- backOnly_fragment_ACCT.fasta
- NoLinker_fragment_ACCT.fasta
- frontOnly_fragment_ACCT.fasta
- Paired1_fragment_ACCT.fasta
- Paired2_fragment_ACCT.fasta
- fragment_ACCT_detail.txt
The format of the last output file fragment_ACCT_detail.txt will be “Name | linker_num | linker_loc | Type | linker_order”. Here are two examples:
HWI-ST1001:238:H0NYEADXX:1:1101:10221:1918      L1:2;L2:1  19,41;42,67;68,97       None    L2;L1;L1
HWI-ST1001:238:H0NYEADXX:1:1101:4620:2609       L1:2 28,46;47,79     Paired  L1;L1
In the first fragment, there are three regions can be aligned to linkers, 2 for L1 and 1 for L2, the order is L2, L1, L1. And they are aligned in region [19,41], [42,67], [68,97] of the fragment. “None” means this fragment is either ‘LinkerOnly’ or ‘IndexOnly’ (in this case it is ‘LinkerOnly’). This fragment won’t be written to any of the output fasta files.
In the second fragment, two regions can be aligned to linkers, and they are both aligned to L1. The two regions are in [28,46], [47,79] of the fragment. the fragment is “Paired” because on both two sides flanking the linker aligned regions, the length is larger than 15nt. The left part will be writen in Paired1_fragment_ACCT.fasta and the right part in Paired2_fragment_ACCT.fasta
Step 5: Align both parts of “Paired” fragment to the genome.
In this step, we will use the Paired1* and Paired2* fasta files output from the previous step. The sequences of part1 and part2 are aligned to the mouse genome mm9 with Bowtie and the pairs with both part1 and part2 mappable are selected as output. We also annotate the RNA types of each part in this step. All of these are implemented using script Stitch-seq_Aligner.py.
usage: Stitch-seq_Aligner.py [-h] [-s samtool_path] [-a ANNOTATION]
                             [-A DB_DETAIL]
                             miRNA_reads mRNA_reads bowtie_path miRNA_ref
                             mRNA_ref

Align miRNA-mRNA pairs for Stitch-seq. print the alignable miRNA-mRNA pairs
with coordinates

positional arguments:
  part1_reads           paired RNA1 fasta file
  part2_reads           paired RNA2 fasta file
  bowtie_path           path for the bowtie program
  part1_ref             reference genomic seq for RNA1
  part2_ref             reference genomic seq for RNA2

optional arguments:
  -h, --help            show this help message and exit
  -b, --bowtie2         set to use bowtie2 (--sensitive-local) for alignment,
                        need to change reference index and bowtie_path
  -u, --unique          set to only allow unique alignment
  -s samtool_path, --samtool_path samtool_path
                        path for the samtool program
  -a ANNOTATION, --annotation ANNOTATION
                        If specified, include the RNA type annotation for each
                        aligned pair, need to give bed annotation RNA file
  -A DB_DETAIL, --annotationGenebed DB_DETAIL
                        annotation bed12 file for lincRNA and mRNA with intron
                        and exon

Library dependency: Bio, pysam, itertools
An annotation file for different types of RNAs in mm9 genome (bed format, ‘all_RNAs-rRNA_repeat.txt.gz’) was included in Data folder. The annotation bed12 file for lincRNA and mRNA (‘Ensembl_mm9.genebed.gz’) was also included in Data folder. One can use the option -a ../Data/all_RNAs-rRNA_repeat.txt.gz -A ../Data/Ensembl_mm9.genebed.gz for annotation.
Here is a example:
Stitch-seq_Aligner.py Paired1_fragment_ACCT.fasta Paired2_fragment_ACCT.fasta
    ~/Software/bowtie-0.12.7/bowtie mm9 mm9 -s samtools
    -a ../Data/all_RNAs-rRNA_repeat.txt.gz -A ../Data/Ensembl_mm9.genebed.gz
    > ACCT_fragment_paired_align.txt
The format for the output file ACCT_fragment_paired_align.txt will be:
| [1] | column 10-17 are the same as column 1-8 except they are for RNA2 instead of RNA1. |
| [2] | subtype can be intron/exon/utr5/utr3 for lincRNA and mRNA (protein-coding), ‘.’ for others |
Note
Bowtie2 (“–sensitive-local” mode) option is added in version 0.3.1 for the user to choose, the reference index and bowtie_path need to be changed accordingly if you use bowtie2 instead of bowtie. User can also choose unique aligned reads or not by setting --unique option.
Step 6: Determine strong interactions.
In this step, we will generate clusters with high coverage separately for all RNA1 (R1) an RNA2 (R2) segments. Then based on the pairing information, we count the interactions between clusters from RNA1 and RNA2. For each interaction between clusters in RNA1 and RNA2, a p-value can be generated based on hypergeometric distribution. Given the p-values of all interactions, we could adjust the p-values controlled by False Discovery Rate (FDR, Benjamini-Hochberg procedure). The strong interactions can be selected by applying a FDR cutoff from adjusted p-values. (See figure below)
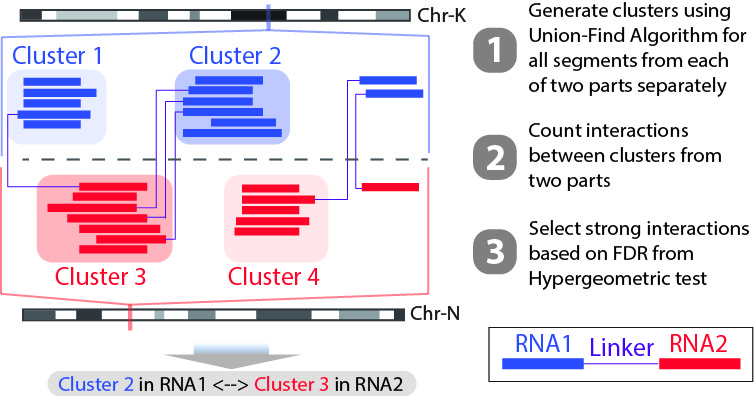
We will use the script Select_strongInteraction_pp.py, parallel computing are implemented for clustering parallelly on different chromosomes:
usage: Select_strongInteraction_pp.py [-h] -i INPUT [-M MIN_CLUSTERS]
                                      [-m MIN_INTERACTION] [-p P_VALUE]
                                      [-o OUTPUT] [-P PARALLEL] [-F]

find strong interactions from paired genomic location data

optional arguments:
  -h, --help            show this help message and exit
  -i INPUT, --input INPUT
                        input file which is the output file of Stitch-seq-
                        Aligner.py
  -M MIN_CLUSTERS, --min_clusterS MIN_CLUSTERS
                        minimum number of segments allowed in each cluster,
                        default:5
  -m MIN_INTERACTION, --min_interaction MIN_INTERACTION
                        minimum number of interactions to support a strong
                        interaction, default:3
  -p P_VALUE, --p_value P_VALUE
                        the p-value based on hypergeometric distribution to
                        call strong interactions, default: 0.05
  -o OUTPUT, --output OUTPUT
                        specify output file
  -P PARALLEL, --parallel PARALLEL
                        number of workers for parallel computing, default: 5
  -F, --FDR             Compute FDR if specified

need Scipy for hypergeometric distribution
The input of the script is the output of Step 5 (ACCT_fragment_paired_align.txt in the example). “annotated_bed” class is utilized in this script.
Here is a example:
Select_strongInteraction_pp.py -i ACCT_fragment_paired_align.txt -o ACCT_interaction_clusters.txt
The column description for output file ACCT_interaction_clusters.txt is:
Column Description 1 chromosome name of cluster in RNA1 2,3 start/end position of cluster in RNA1 4 RNA type for cluster in RNA1 5 RNA name for cluster in RNA1 6 RNA subtype for cluster in RNA1 7 # of counts for cluster in RNA1 8-14 Same as 1-7, but for cluster in RNA2 15 # of interactions between these two clusters 16 log(p-value) of the hypergeometric testing
We also have a set of scripts within the package to call strong interactions based on either clusters or RNA annotations, see the following table for detail:
Call interaction based on Consider Left/Right Script Clusters (interaction sites) Yes Select_strongInteraction_pp.py Clusters (interaction sites) No Select_strongInteraction_pp_noLeftRight.py RNA annotations Yes Select_strongInteraction_RNA.py RNA annotations No Select_strongInteraction_RNA_noLeftRight.py
Step 7: Visualization of interactions and coverages.
There are two ways of visulization provided ( LOCAL and GLOBAL ):
Other functions
Determine the RNA types of different parts within fragments.
Find linker sequences within the library.
Find intersections between two different interaction sets based on genomic locations
The script tool intersectInteraction.py could be used to identify overlap of interactions between two interaction set from independent experiments based on genomic locations (two replicates or two different samples)
usage: intersectInteraction.py [-h] -a FILEA -b FILEB [-s START] [-n NBASE]
                               [-o OUTPUT] [-c]

find intersections (overlaps) between two interaction sets

optional arguments:
  -h, --help            show this help message and exit
  -a FILEA, --filea FILEA
                        file for interaction set a
  -b FILEB, --fileb FILEB
                        file for interaction set b
  -s START, --start START
                        start column number of the second part in each
                        interaction (0-based), default:7
  -n NBASE, --nbase NBASE
                        number of overlapped nucleotides for each part of
                      interactions to call intersections, default: 1
  -o OUTPUT, --output OUTPUT
                        specify output file
  -p, --pvalue          calculate p-values based on 100times permutations

require 'random'&'numpy'&'scipy' module if set '-p'
if “-p” option is set, then the program will do permutation for 100 times by shuffling the two partners of interactions in set a. A p-value will be calculate based on permutation distribution.
Find intersections between two different interaction sets based on annotation
The script tool intersectInteraction_genePair.R could be used to identify overlap of interactions between two interaction set from independent experiments based on the RNA annotations (two replicates or two different samples)
usage: intersectInteraction_genePair.R [-h] [-n NUM [NUM ...]] [-p] [-r]
                                       [-o OUTPUT]
                                       interactionA interactionB

Call intersections based on gene pairs

positional arguments:
  interactionA          the interaction file a,[required]
  interactionB          the interaction file b,[required]

optional arguments:
  -h, --help            show this help message and exit
  -n NUM [NUM ...], --num NUM [NUM ...]
                        Column numbers for the gene name in two part,[default:
                        [5, 12]]
  -p, --pvalue          set to do 100 permutations for p-value of overlap
  -r, --release         set to only require match of chromosome and RNA name,
                        but not subtype
  -o OUTPUT, --output OUTPUT
                        output intersection file name, pairs in A that overlap
                        with B, [default: intersect.txt]
if “-p” option is set, then the program will do permutation for 100 times by shuffling the two partners of interactions in both set a and set b. A p-value will be calculate based on permutation distribution.
RNA structure prediction by adding digestion site information
The script will take selfligated chimeric fragments from given snoRNA (ID) and predict secondary structures with and without constraints of digested single strand sites. It is also able to compare the known structure in dot format if the known structure is available and specified by “-a”. The script needs RNAStructure software for structure prediction (“-R”) and and VARNA command line tool for visualization (“-v”).
usage: RNA_structure_prediction.py [-h] [-g GENOMEFA] [-R RNASTRUCTUREEXE]
                                 [-a ACCEPTDOT] [-o OUTPUT]
                                 [-s samtool_path] [-v VARNA]
                                 [-c COLORMAPSTYLE]
                                 ID linkedPair

plot RNA structure with distribution of digested end, refine structure with
loc of digested end

positional arguments:
  ID                    Ensembl gene ID of RNA
  linkedPair            file for information of linked pairs, which is output
                        of 'Stitch-seq_Aligner.py'

optional arguments:
  -h, --help            show this help message and exit
  -g GENOMEFA, --genomeFa GENOMEFA
                        genomic sequence,need to be fadix-ed
  -R RNASTRUCTUREEXE, --RNAstructureExe RNASTRUCTUREEXE
                        folder of RNAstrucutre suite excutable
  -a ACCEPTDOT, --acceptDot ACCEPTDOT
                        accepted structure in dot format, for comparing of
                        accuracy, no comparison if not set
  -o OUTPUT, --output OUTPUT
                        output distribution of digested sites with dot
                        structures, can be format of eps, pdf, png,...
  -s samtool_path, --samtool_path samtool_path
                        path for the samtool program
  -v VARNA, --varna VARNA
                        path for the VARNA visualization for RNA
  -c COLORMAPSTYLE, --colorMapStyle COLORMAPSTYLE
                        style of color map, choose from: "red", "blue",
                        "green", "heat", "energy", and "bw",default:"heat"
Here is a example:
python RNA_structure_prediction.py \
  ENSMUSG00000064380 \
  /data2/sysbio/UCSD-sequencing/2013-11-27-Bharat_Tri_Shu/Undetermined_indices/Sample_lane8/ACCT_GGCG_combine/ACCT_GGCG_fragment_paired_align_selfLigation.txt \
  -a Snora73_real_dot.txt \
  -o Snora73_distribution.pdf
Here “Snora73_real_dot.txt” is dot format of known Snora73 structure. A example file for “Snora73_real_dot.txt”:
>Snora73
CCAACGUGGACAACCCAGGAGGUCACUCUCCCUGGGCUCUGUCCUAGUGGCAUAGGGGAGCAUAGGCCUUGCCCAGUGACGUACAGUCCCUUUCCACGGCGUUGGAGAUGAAGCUGGGCUUUGUGCCCGCGCCUGCAUAUUCCUACGACUUCUCAGAGUCCUGUGGACAGUGACUGAGGAGGCAAACCAUGCAGGAAACAGUG
((((((((((((((((.((((....))))....))))..)))))..((((.....(((((((((((.........))..)))))..))))...)))).)))))))..........................(((((((..........((((((...((((...)))).......)))))).......)))))))........
The first line is the name of the small RNA, the second line is the RNA sequence and the third line is the dot format of secondary structure.
- This program will generate these files:
- Three eps files with secondary structures (“Predict”, “Refine”, “Accepted (known)”).
- An output pdf file contains the distribution of digested sites in whole RNA molecule.
- Two JSON files (“Predict”, “Refine”) to be uploaded into RNA2D-browser (Developed by Xiaopeng Zhu) (using “read local file”)
An example of the graph from eps file:
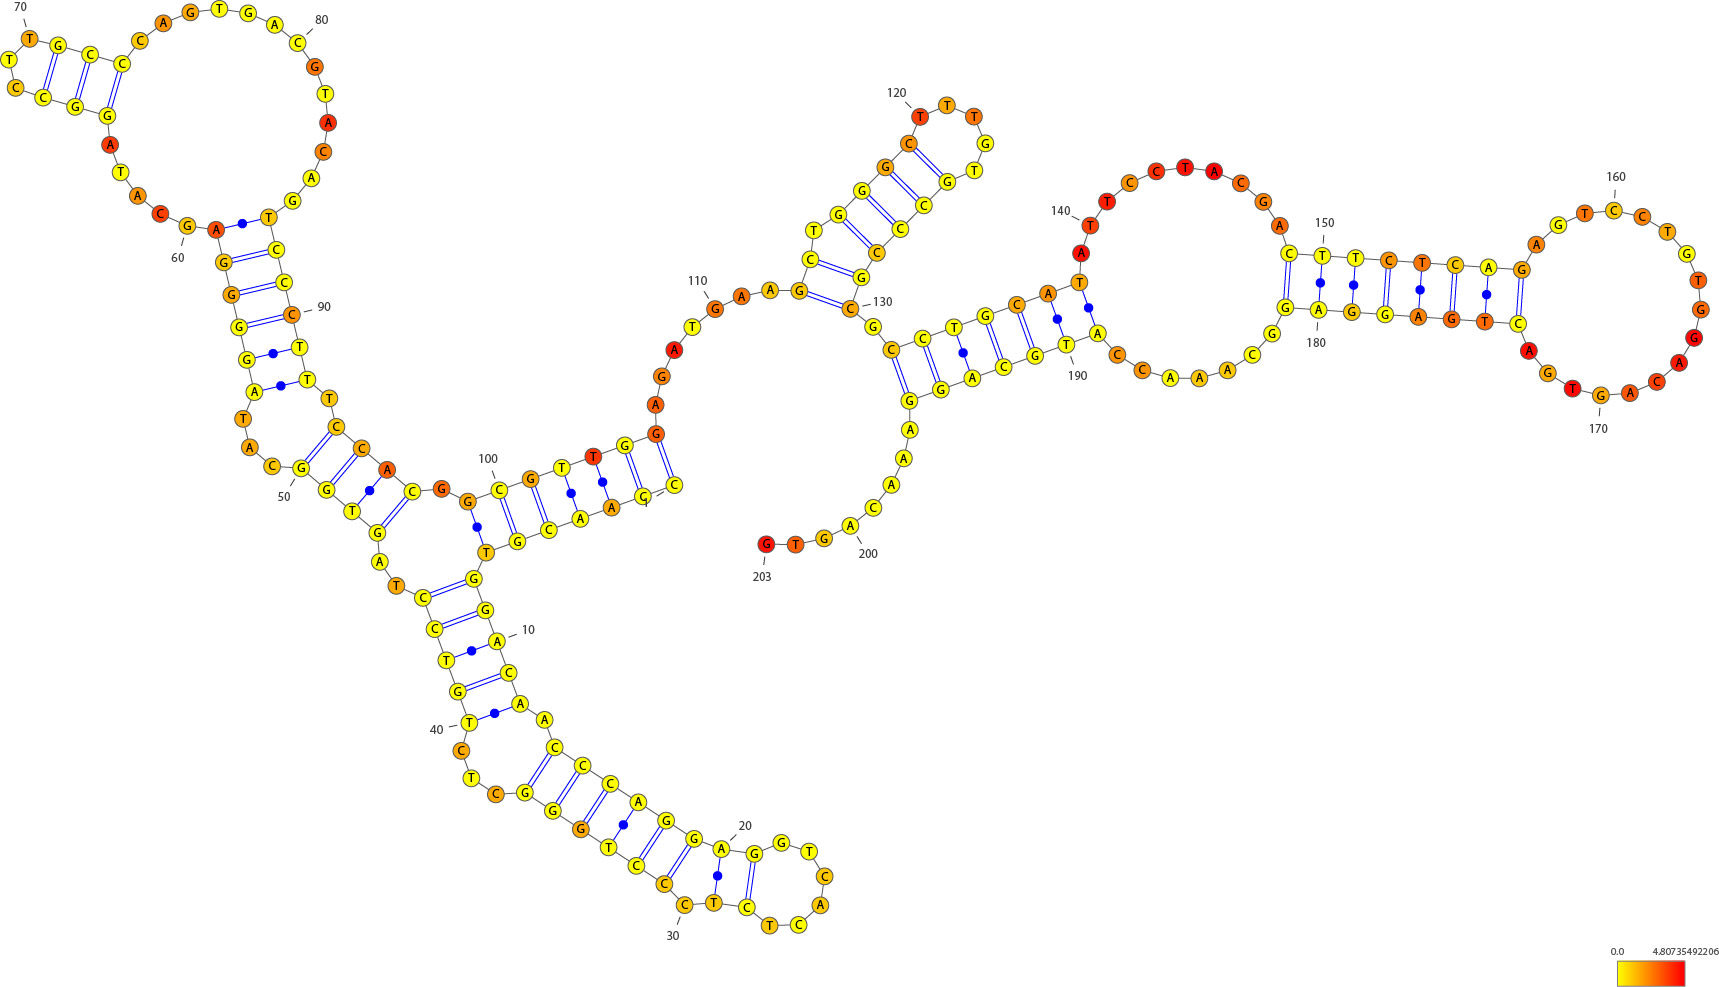
The structure is predicted by “Fold” function of RNAstructure software and ploted by VARNA software. The distributions of RNase I digested sites across the RNA molecule are marked using a color scale on top of accepted snoRNA structures. The redder the nucleotide, the more frequently it could be digested by RNase I as suggested by our data. Non-base-paired regions tend to be more likely digested.
An example of the graph from pdf file with distribuiton of digested sites:
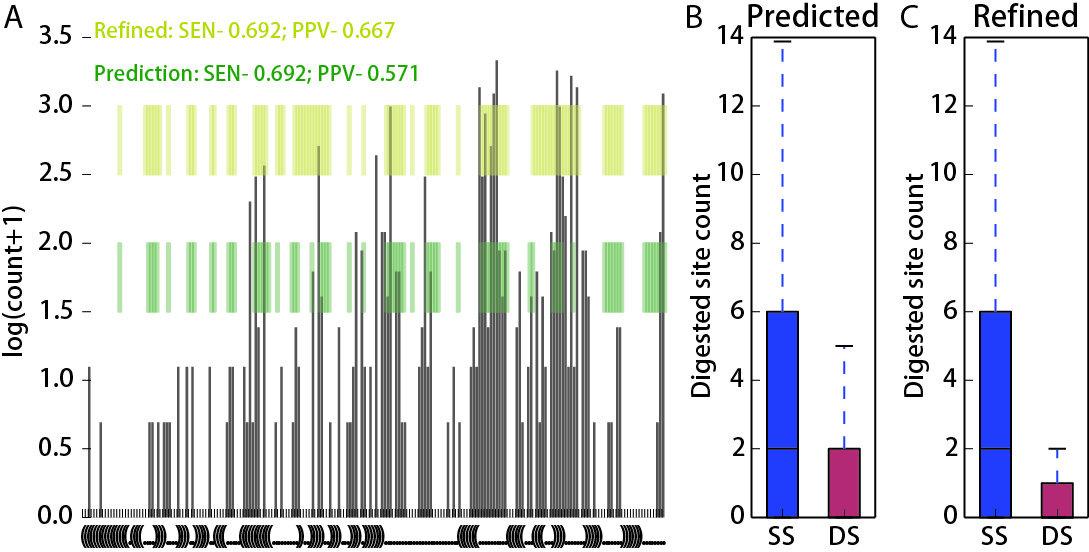
legend: (A) Distribution of digested locations within the sequence of Snora73 RNA. The secondary structures were first predicted based only on the RNA sequences and then refined by adding information of single strand frequencies. The green regions are single stranded regions from the sequence based predicted structure. And the yellow regions are single stranded regions from the refined structure. Compared with the accepted structure (from fRNAdb), the positive predictive value is higher for the refined structure compared to the sequence based structure. The sensitivity is the same. (B, C) Counts of digested sites in the single stranded and double stranded portions of sequence-based predicted structure (B) and refined structure (C).
An example of graph generated by RNA2D-browser (Developed by Xiaopeng Zhu) with the JSON file (PDF version cannot show this see HTML version)
The whole cirle shows the total length of SNORA73, the blue intensity histogram shows the distribution of RNase I digested locations. The dark grey links inside show the locations of different stems within the RNA structure. <\p>
splicing intermediates detection within snoRNA-mRNA interactions
This script is used to detect the percentage of potential splicing intermediates from all snoRNA-mRNA interactions within a sample. One snoRNA-mRNA interaction is considered as a potential splicing intermediate interaction if: snoRNA gene is located in the intronic region of its mRNA interacting partner. The script need an annotation bed file (all_RNAs-rRNA_repeat.txt):
usage: snoRNA_mRNA_statistics.py [-h] [-A ANNOTATION] [-s START] [-o OUTPUT]
                               interaction

Statistics for snoRNA-mRNA interactions, percentage of splicing intermediates
within all snoRNA-mRNA interactions

positional arguments:
  interaction           Interaction file from output of
                        'Select_strongInteraction_pp.py', or linked fragment
                        pair file from output of 'Stitch-seq_Aligner.py'

optional arguments:
  -h, --help            show this help message and exit
  -A ANNOTATION, --Annotation ANNOTATION
                        Annotation bed file for locations of mRNA genes
  -s START, --start START
                        start column number of the second region in
                        interaction file, default=7
  -o OUTPUT, --output OUTPUT
                        Set to output all snoRNA-mRNA interactions as splicing
                        intermediates, not output if not set

Require: xplib, subprocess
Here is a example:
python snoRNA_mRNA_statistics.py \
  /data2/projects/rnarna/2013-11-RNA-RNA/ACCT_GGCG_combine/ACCT_GGCG_interaction_clusters_rmrRNA.txt \
   -A ../Data/all_RNAs-rRNA_repeat.txt.gz
The output will be:
snoRNA-mRNA-interactions:       8043
SplicingIntermediates:  4
Percentage      0.0497%
If -o is set with a file name, then the 4 splicing intermediates like interactions will be output to that file.
The input can also be an linked fragment pair file, see this example:
python snoRNA_mRNA_statistics.py \
  /data2/projects/rnarna/GGCG_combine_MEF_1/GGCG_fragment_paired_align_rmSingleFragment.txt \
  -s 9 \
  -A ../Data/all_RNAs-rRNA_repeat.txt.gz
The output print is:
snoRNA-mRNA-linkedPair: 24138
SplicingIntermediates:  19
Percentage      0.0787%